While some assays utilize antibodies to study cell health, proliferation, cell cycle or apoptosis, other types of experiments can rely on non-antibody based methods of assessment, often called non-antibody chemical probes. These are reagents that localize to an organelle or indicate health based on chemical characteristics like hydrophobicity, charge, size, and enzymatic activation.


Product Highlights

For our full listing of reagents, click through our sections below.


Image showing a cell, the organelles it contains within, and the reagents BioLegend provides to investigate them.

We have divided our chemical probes into tables based on their function or localization to help you choose the right reagent for your labeling application. Cell type suitability indicates whether this reagent labels live cells exclusively or whether it can also label the dead cells in a live cell culture or cells that have been previously fixed with buffers like paraformaldehyde or methanol. Sample suitability indicates whether this reagent can be used to label already fixed tissue sections or single cells in suspension or cell culture. Application indicates their suitability for being analyzed by flow cytometry, microscopy platforms or both. Fixation simply indicates whether the reagent, once used to label a cell sample, will be retained with a paraformaldehyde fixation.


Expand tables below to view chemical probes by localization and/or function.


  Spectra Functionality Cell Type Suitability Sample Suitability Application Fixation
Chemical Probe     Live Dead/ Fixed Tissue Cell Culture/ Single Cells Flow Cytometry Microscopy Retention with PFA Treatment
Lipid Droplet Probe Green Exmax/Emmax 427, 585 nm Organelle staining • •   • • • •
ATP Red Exmax/Emmax 590, 620 nm ATP production indicator • •   • • • •
Cellular Senescence Kit Red Exmax/Emmax 544, 647 nm Senescence indicator •     • • • •
Apotracker™ Green View Spectra Apoptosis indicator •     • • •  
Apotracker™ Tetra Alexa Fluor® 647 View Spectra Apoptosis indicator •     • • •  
Annexin V Several formats available Apoptosis indicator •     • •   •
7-AAD View Spectra Dead cell indicator   • • • • •  
Zombie UV387™ View Spectra Fixable cell death indicator   •   • • • •
Zombie UV™ View Spectra Fixable cell death indicator   •   • • • •
Zombie Violet™ View Spectra Fixable cell death indicator   •   • • • •
Zombie Aqua™ View Spectra Fixable cell death indicator   •   • • • •
Zombie Yellow™ View Spectra Fixable cell death indicator   •   • • • •
Zombie Green™ View Spectra Fixable cell death indicator   •   • • • •
Zombie B550™ View Spectra Fixable cell death indicator   •   • • • •
Zombie YG581™ View Spectra Fixable cell death indicator   •   • • • •
Zombie Red™ View Spectra Fixable cell death indicator   •   • • • •
Zombie R685™ View Spectra Fixable cell death indicator   •   • • • •
Zombie R718™ View Spectra Fixable cell death indicator   •   • • • •
Zombie NIR™ View Spectra Fixable cell death indicator   •   • • • •
Helix NP™ Blue View Spectra Viability indicator   • • • • •  
Helix NP™ Green View Spectra Viability indicator   • • • • •  
Helix NP™ NIR View Spectra Viability indicator   • • • • •  


  Spectra Functionality Cell Type Suitability Sample Suitability Application Fixation
Chemical Probe     Live Dead/ Fixed Tissue Cell Culture/ Single Cells Flow Cytometry Microscopy Retention with PFA Treatment
Flash Phalloidin™ Green 488 View Spectra F-actin staining   • • •   • N/A
Flash Phalloidin™ Red 594 View Spectra F-actin staining   • • •   • N/A


(+)    Cytoplasm


  Spectra Functionality Cell Type Suitability Sample Suitability Application Fixation
Chemical Probe     Live Dead/ Fixed Tissue Cell Culture/ Single Cells Flow Cytometry Microscopy Retention with PFA Treatment
Calcein-AM View Spectra Vitality indicator •     • • •  
Calcein Red-AM View Spectra Vitality indicator •     • • •  
Calcein Violet-AM View Spectra Vitality indicator •     • • •  
Cellular Senescence Kit Red Exmax/Emmax 544, 567 nm Cellular senescence/cell cycle •     • • • •
CFSE View Spectra Proliferation, cell tracking •   • • • • •
Tag-it Violet™ View Spectra Proliferation, cell tracking •   • • • • •


  Spectra Functionality Cell Type Suitability Sample Suitability Application Fixation
Chemical Probe     Live Dead/ Fixed Tissue Cell Culture/ Single Cells Flow Cytometry Microscopy Retention with PFA Treatment
Endoplasmic Reticulum Probe Green View Spectra Organelle staining •     • • •  
Endoplasmic Reticulum Probe Red View Spectra Organelle staining •     • • •  


(+)    Golgi Appartus


  Spectra Functionality Cell Type Suitability Sample Suitability Application Fixation
Chemical Probe     Live Dead/ Fixed Tissue Cell Culture/ Single Cells Flow Cytometry Microscopy Retention with PFA Treatment
Golgi Detection Probe Red Exmax/Emmax 
544, 570 nm
Organelle staining •     •   •  


(+)    Lysosome


  Spectra Functionality Cell Type Suitability Sample Suitability Application Fixation
Chemical Probe     Live Dead/ Fixed Tissue Cell Culture/ Single Cells Flow Cytometry Microscopy Retention with PFA Treatment
LysoFQ-GBA (Lysosomal GCase Probe Green) Exmax/Emmax 503, 509 nm Gcase activity reporter •     • • • •
LysoFix-GBA (Lysosomal GCase Probe Yellow) Exmax/Emmax 541, 567 nm Gcase activity reporter •     • • • •
Lysosome Probe Green View Spectra Organelle staining •     • • •  
Lysosome Probe Orange View Spectra Organelle staining •     • • •  
Lysosome Probe Red View Spectra Organelle staining •     • • •  
Lysosome Probe Deep Red View Spectra Organelle staining •     • • •  
Lysosome Probe NIR View Spectra Organelle staining •     • • •  


(+)    Mitochondria


  Spectra Functionality Cell Type Suitability Sample Suitability Application Fixation
Chemical Probe     Live Dead/ Fixed Tissue Cell Culture/ Single Cells Flow Cytometry Microscopy Retention with PFA Treatment
JC-10 Mitochondrial Membrane Potential Kit View Spectra Depolarization/apoptosis indicator •     • • •  
MitoSpy™ Green FM View Spectra Vitality indicator •     • • •  
MitoSpy™ Orange CMTMRos View Spectra Vitality indicator •     • • • •
MitoSpy™ Red CMXRos View Spectra Vitality indicator •     • • • •
MitoSpy™ NIR DiIC1(5) View Spectra Vitality indicator •     • • •  


(+)    Nucleus


  Spectra Functionality Cell Type Suitability Sample Suitability Application Fixation
Chemical Probe     Live Dead/ Fixed Tissue Cell Culture/ Single Cells Flow Cytometry Microscopy Retention with PFA Treatment
Helix NP™ Blue View Spectra Viability indicator   • • • • •  
Helix NP™ Green View Spectra Viability indicator   • • • • •  
Helix NP™ NIR View Spectra Viability indicator   • • • • •  
CytoPhase™ Violet View Spectra Cell cycle/viability indicator • • • • • •  
DRAQ5™ View Spectra Cell cycle/viability indicator • • • • • •  
DRAQ7™ View Spectra Cell cycle/viability indicator   • • • • •  
Propidium Iodide View Spectra Cell cycle/viability indicator   • • • • •  
DAPI View Spectra Nuclear stain/cell cycle   • • • • •  


  Spectra Functionality Cell Type Suitability Sample Suitability Application Fixation
Chemical Probe     Live Dead/ Fixed Tissue Cell Culture/ Single Cells Flow Cytometry Microscopy Retention with PFA Treatment
Autophagy Detection Probe Blue Exmax/Emmax 
330, 520 nm
Autophagy indicator •     •   •  
Autophagy Detection Probe Green Exmax/Emmax 
485, 530 nm
Autophagy indicator •     •   •  
Phagocytosis Detection Kit Red Exmax/Emmax 
570, 600 nm
Phagocytosis activity •     • • •  


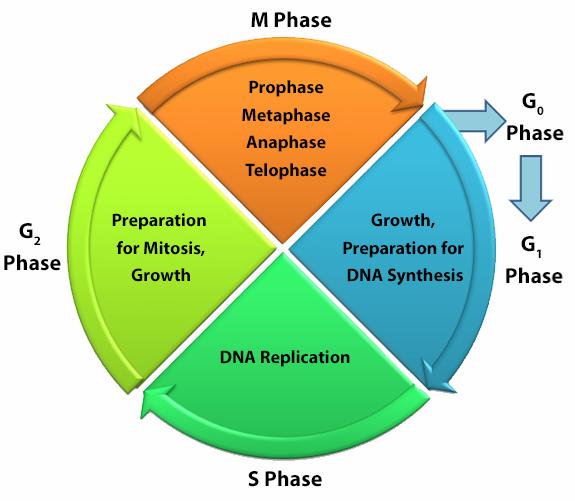
Cellular division for any cell type is dependent on the inherent function, location and the response of cells to repair, apoptosis, or death. To divide, cells must duplicate a copy of their DNA, increase mitochondrial density, and assemble/synthesize microtubules during interphase. G2 is a checkpoint stage of interphase where the cell has two sets of dsDNA and must commit to mitosis. Mitosis is the actual division stage where two daughter cells are created. There can be symmetrical or asymmetrical division depending on the cell and tissue type. Mitosis can be further subdivided into prophase, metaphase, anaphase, and telophase as the nucleus undergoes division and chromatids are pulled away from one another. After mitosis, the cell will undergo the G0/G1 phase when the cells rest to become ready for the next round of replication.

cycle

During G0/G1, S, and G2 phases, some fluorogenic nucleic acid stains selectively bind dsDNA stoichiometrically to give us measurements of DNA mass based on fluorescence intensity. Cell-permeant nucleic acid stains can be used in instances where cells will be analyzed live. Propidium Iodide, DAPI, DRAQ5™, DRAQ7™, CytoPhase™ Violet, Helix NP™ NIR,  Helix NP™ Blue, and Helix NP™ Green can all be used to stain fixed cells for cell cycle analysis. However, only CytoPhase™ Violet and DRAQ5™ can be used to assess DNA content of live cells.


For additional reagents (including antibodies) on cell cycle analysis or DNA replication, check here.

Live and Dead Cell Cycle Analysis

CytoPhase™ Violet


Live Ramos cells treated with 5 µM CytoPhase™ Violet dye for 90 minutes at 37°C. 

DRAQ5™


Live C57BL/6 mouse bone marrow cells were stained with DRAQ5™.
 

Helix NP™ NIR


C57BL/6 mouse thymus cells were fixed using 70% chilled ethanol. The cells were incubated for one hour at -20°C, washed, then stained with Helix NP™ NIR at 5 µM.

ProductsHere

Login / Register
Remember me
Forgot your password? Reset password?
Create an Account